Once I was in a meeting and two numbers were presented by the leader team:
Sales were down 10%.
Production was above target.
One side of the business was underperforming.
The other was doing “Ok.”
So… everything going well, right?!
The Hidden Risk in Growing Companies
In larger companies, there is usually a layer of leadership whose role is to connect the dots.
They look across sales, operations, and finance.
They review dashboards, challenge assumptions, and ask uncomfortable questions.
Not because one number is wrong —
but because the combination of numbers might not make sense.
That’s often what keeps the business aligned.
In small and mid-sized companies, the reality is different.
Many are led by founders — people who built the business through instinct, hard work, and deep belief in what they do.
They know the product.
They know the customer.
They move fast.
But as the business grows, complexity grows with it.
And without a structured way to connect KPIs across different areas, it becomes very easy to fall into a subtle trap:
Making good decisions in isolation…
that don’t work well together.
Let’s Put Some Numbers Behind It
Sometimes the story only becomes clear when you translate KPIs into actual numbers.
The Plan (Monthly Budget)
- Sales forecast: 10,000 units
- Selling price: $10 per unit
- Expected revenue: $100,000
- Production plan: 10,000 units
- Cost per unit: $6
- Expected production cost: $60,000
Everything balanced.
Produce what you sell.
What Actually Happened
Sales (Reality)
- Units sold: 9,000 units (10% below budget)
- Revenue: $90,000
Production (Reality)
- Units produced: 12,000 units (20% above plan)
- Production cost: $72,000
At first glance:
- Sales → 🔴 below target
- Production → 🟢 above target
And that’s exactly where the confusion starts.
The Inventory Effect
You sold 9,000 units, but produced 12,000 units.
That means:
3,000 units went into inventory.
And those units are not free.
- Cost per unit: $6
- Inventory added: 3,000 × $6 = $18,000
That’s $18,000 in cash that is no longer cash.
It is now sitting on a shelf.
Now Finance Enters the Conversation
Finance is not looking at units.
Finance is looking at cash.
Let’s compare:
Expected Cash Flow
- Cash in (sales): $100,000
- Cash out (production): $60,000
→ Net: +$40,000
Actual Cash Flow
- Cash in (sales): $90,000
- Cash out (production): $72,000
→ Net: +$18,000
But here’s the key point:
Out of that $72,000 spent on production, $18,000 is now sitting in inventory.
Only part of that spend is actually working.
The rest is trapped cash.
The KPI Conflict
| Area | KPI Result | Interpretation (Isolated) |
|---|---|---|
| Sales | -10% vs budget | Weak performance |
| Production | +20% vs budget | Strong performance |
| Inventory | Increasing | “Buffer” |
| Cash Flow | Tight | Finance concern |
Individually, each KPI makes sense.
Together, they tell a different story:
The company is producing faster than it is selling —
and using cash to do it.
Good numbers rarely get questioned.
And that’s where risk starts.
The Real Problem Was Not Performance
It was alignment.
Production was optimized for:
- Efficiency
- Utilization
- Output
But the business needed:
- Demand alignment
- Inventory control
- Cash preservation
So even though production was doing a “good job”…
It was solving the wrong problem.
Why This Happens So Often
Because KPIs are usually designed by function:
- Sales → Revenue
- Operations → Output / efficiency
- Finance → Cash / cost control
Each one is valid.
But rarely are they connected in real time.
So teams end up optimizing their own scoreboard.
And no one is watching the full game.
The Takeaway
In large companies, there are people whose role is exactly this:
To step back.
To connect the dots.
To challenge when things don’t align.
They are not looking at one KPI.
They are reading the story behind all of them.
In smaller and growing businesses, that role doesn’t always exist.
Or it exists — but without the time, structure, or visibility to do it consistently.
And that’s where the risk lives.
Because when decisions are made based on isolated signals:
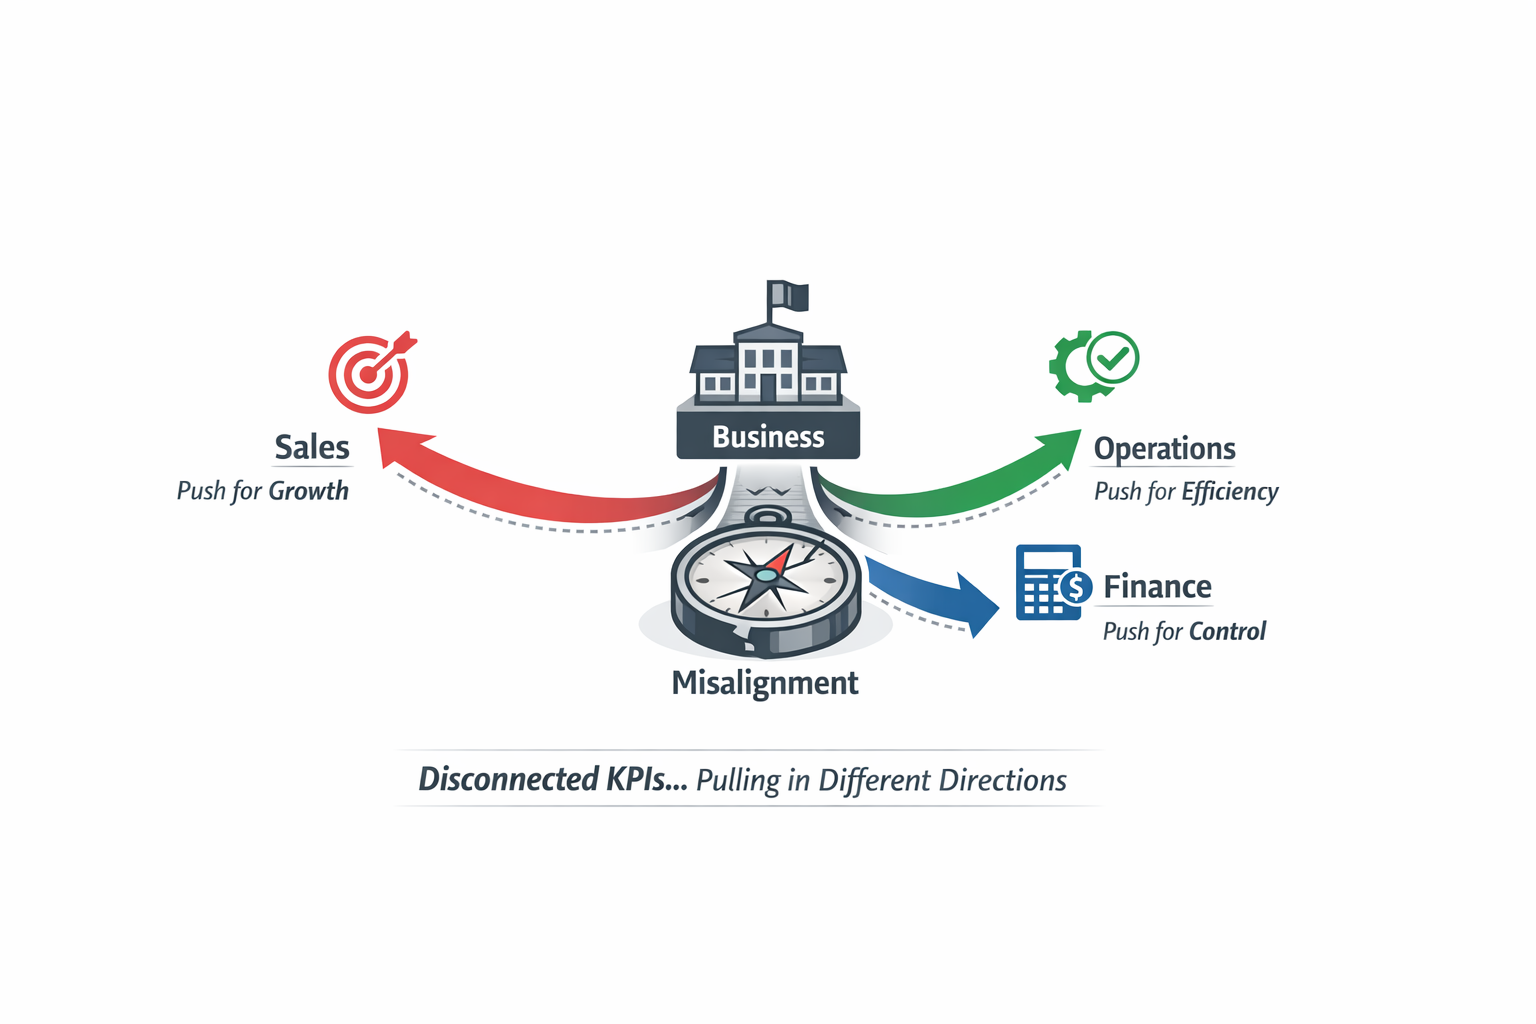
- Sales pushes for growth
- Operations pushes for efficiency
- Finance pushes for control
Everyone is doing their job.
But the business can still move in the wrong direction.
Sometimes no one is watching the full picture.
Sometimes the data comes too late.
Sometimes the connection simply isn’t made.
And the business drifts — not because of bad decisions,
but because of disconnected ones.
KPIs are like wind in the sails.
Without direction, they don’t move you forward.
They just move you somewhere else.
Leave a Reply